


Global mining uses more than 57,000 km² of land
Victor Maus, Stefan Giljum, Jakob Gutschlhofer, Sebastian Luckeneder & Mirko Lieber
FINEPRINT Brief No. 12, October 2020
The land area used for mineral extraction is a key indicator for understanding and mitigating the environmental impacts caused by the extractive sector. We quantified the extents of more than six thousand active mining sites across the globe through visual interpretation of satellite images. We find that mining activities around the world occupy 57,277 km². More than 50% of land areas are concentrated in only five countries: China, Australia, the United States, Russia, and Chile. The new data set provides the foundation for a range of future applications, for example, on the impacts of mining on deforestation and biodiversity loss.
This FINEPRINT Brief builds on the paper ‘A global-scale data set of mining areas’ published by Maus and colleagues in Nature Scientific Data. The data set is available for download from PANGAEA and visualised with the FINEPRINT Viewer.
Global extraction of minerals grew at an unprecedented pace in the past decades, causing a wide range of social and environmental impacts around the world [1]. Growing demand for essential minerals and declining quality of ores lead to larger volumes of disposed unused materials, increasing appropriation of land [2]. The direct land used by mining is a crucial indicator of environmental pressure, which is closely associated with a range of negative impacts, including fragmentation and degradation of ecosystems and biodiversity loss [3]. Data on land use of mining is also important to further develop land footprint indicators that inform about land required along global supply chains to satisfy final consumption. However, comprehensive information about the amount of land areas used for mining purposes across all countries worldwide was not yet available.
Crafting mining extents from satellite images
In our study, we contribute to filling this knowledge gap by creating a new data set of mining extents derived by visual interpretation of satellite images. The new data set covers more than six thousand mining sites distributed across the entire globe. These mining sites have reported mineral extraction or activities between the years 2000 and 2017 according to SNL Metals and Mining data base [4]. The data set covers coal, all metal ores and some industrial minerals, but excludes mining sites of construction minerals, such as sand and gravel. Within the investigated regions, we delineated the mining areas (i.e., drew polygons) by visual interpretation of three satellite data sources: Google Satellite, Microsoft Bing Imagery and Sentinel-2. Figure 1 illustrates three examples of mines and related polygons that we drew based on the satellite data.
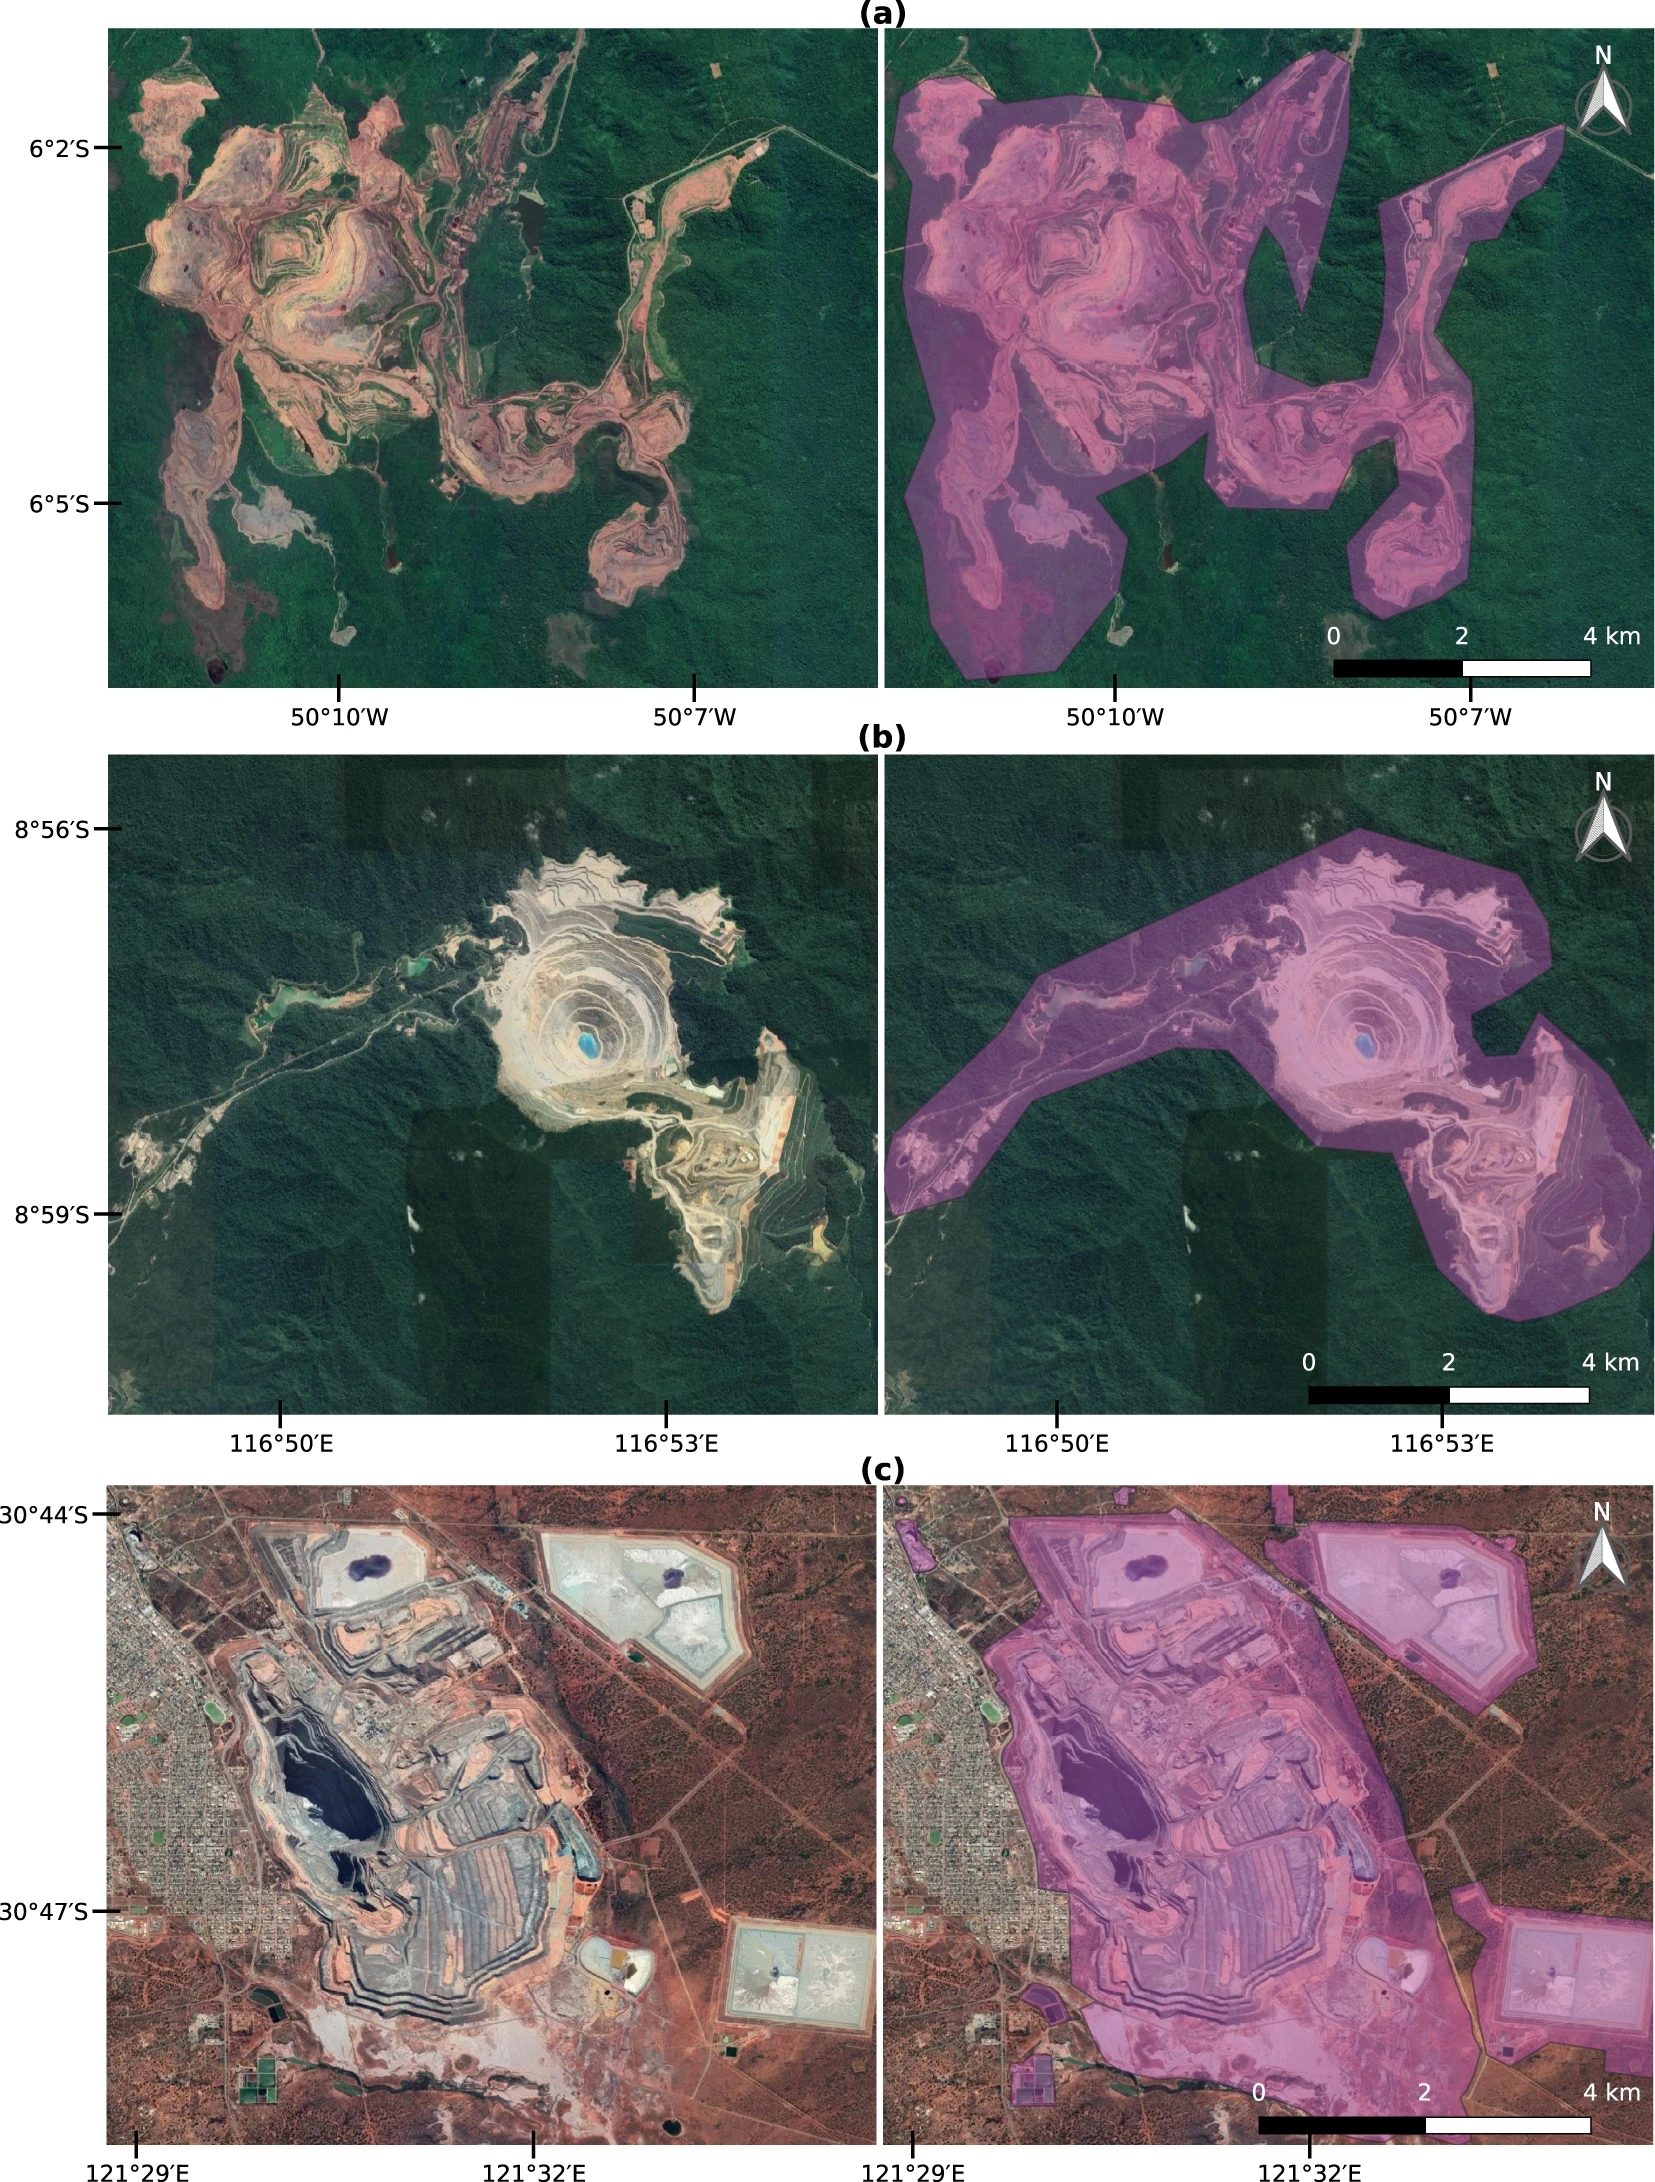
Figure 1: Examples of mapped mining polygons with Google Satellite images background. (a) Carajas iron ore mine in Brazil, (b) Batu Hijau copper-gold mine in Indonesia, and (c) Super Pit gold mine in Australia
The first example shows the main open cut of the Carajas iron ore mine complex in the Brazilian Amazon, which is among the world’s largest iron ore mining operations. The next example shows the Batu Hijau copper-gold mine. Despite its large open cut, this mine does not use much area for unused material, as the disposal of its tailings takes place in the ocean. The third example is the Super Pit gold mine in Australia, which is located in one of the largest gold producing regions in the world.
World-wide extent of mining areas
Figure 2 shows an overview of the geographical distribution of our mapped mining areas across the globe, resampled to 50 km grid cells to facilitate visualisation.

Figure 2: Global distribution of the mapped mining areas, aggregated to 50 km grid cells

Figure 3: Percentage of mining area mapped per country
From Figure 2 we can see concentrations of mining areas in many regions, for example, in northern Chile mainly due to copper extraction and northeastern Australia and East Kalimantan in Indonesia because of coal mining. We can also show that mining areas are highly concentrated in only a few countries. China, Australia, the United States, Russia, and Chile together account for 51% of the mapped mining area. Another ten countries account for 30%, and the remaining countries add up to 19% of the total mapped mining area (Figure 3).
Applications and improvements of the new data set
This novel data set can help improving environmental impact assessments of the global mining sector. For example, it can serve as the basis for studying mining-induced deforestation patterns. The data can also serve as a benchmark for further monitoring the temporal evolution of mining sites around the world and as training and validation data to support automated classification of mines using satellite images.
Although the first version of the data covers a large number of mining sites across the world, there are options for extensions. Work is currently ongoing to extend the data set to inactive mining locations such as closed sites and exploration stages, in order to deliver a complete account on the land used by the global extractive sector.
Citation
Maus, V., Giljum, S., Gutschlhofer, J., Luckeneder, S., Lieber, M. 2020. Worldwide mining activities use more than 57,000 km2 of land. Results from a global assessment of mining land areas based on satellite data. FINEPRINT Brief No. 12. Vienna University of Economics and Business (WU). Austria.
References
[1] UNIRP. Global Resources Outlook 2019: Natural resources for the future we want. A report of the International Resource Panel 2019. doi:10.2788/544302.
[2] Sonter LJ, Moran CJ, Barrett DJ, Soares-Filho BS. Processes of land use change in mining regions. J Clean Prod 2014;84:494–501. doi:10.1016/j.jclepro.2014.03.084.
[3] Werner TT, Mudd GM, Schipper AM, Huijbregts MAJ, Taneja L, Northey SA. Global-scale remote sensing of mine areas and analysis of factors explaining their extent. Glob Environ Change 2020;60. doi:10.1016/j.gloenvcha.2019.102007.
[4] S&P Global Market Intelligence. SNL Metals and Mining Database 2018.