


Using satellite earth observations to map global resource extraction and related environmental impacts: examples from agriculture and mining
Victor Maus & Stefan Giljum
FINEPRINT Brief No. 10, March 2020
Satellite earth observation data are a key source of information to improve sustainability assessments of global supply chains. Earth observation is the only viable and cost-effective data source capable of providing regular and consistent information about a wide range of resource extraction activities and their related impacts across countries worldwide. In this Brief, we discuss the potentials of remote sensing data to analyse spatiotemporal patterns of resource extraction and impacts and present examples from the agricultural and mining sectors.
In the past few years, rapid progress has been made to better understand the changing structures of supply chains and to calculate their accumulated environmental impacts, starting from the location where agricultural products are harvested and mineral resources are extracted all the way to the consumption of final products. However, the spatial resolution of existing models is mostly limited to the national level. This lack of spatial detail hinders the accurate calculation of global footprints as the models disregard the spatial heterogeneity of environmental and social conditions within countries supplying natural resources [1]. For example, mining and agricultural activities can have varying impacts on water scarcity, deforestation or biodiversity loss depending on the exact location of resource extraction. Therefore, advancing and improving calculations of environmental footprints requires accurate global accounts of production activities and related impacts at a high spatial resolution.
The only viable data source that can provide accurate and timely spatial information about agricultural production and mineral extraction at the global scale is satellite earth observation. New satellites and open data policies have significantly increased the availability of earth observation data in recent years. At the same time, the rapid expansion of processing capabilities and development of novel algorithms can produce information with high spatial resolution and wide geographic coverage that would otherwise be difficult to obtain. Remote sensing can therefore support efforts by business and policy to reduce environmental impacts along global supply chains.
In FINEPRINT, we use satellite-based earth observation data to map resource extraction and related environmental impacts. In this Brief, we discuss the potentials of remote sensing data presenting examples from agricultural production and mineral extraction.
Agricultural production maps
Crop maps downscaled from national agricultural statistics, such as MAPSPAM [2], are currently the only data source to investigate spatially explicit production trends for different agricultural products. However, these data sets have a coarse spatial resolution (5 arc minutes, about 10x10 km at the equator) and irregular temporal coverage, incompatible with requirements to improve calculations of environmental footprints. Moreover, downscaled crop maps are sensitive to the degree of disaggregation of the agricultural statistics that results in considerable disagreement between the available data products [3]. Available global maps thus do not provide the required level of information to assess trends in agricultural commodities production on a high spatial and temporal resolution.
Accurate agricultural production maps require identifying crop-specific land areas at the global level and earth observation is the only viable source to provide this information. Mapping crop types on large-scale is a big challenge and requires overcoming problems such as cloud cover in optical data, compatibility of fields size and sensor resolution, processing scalability, and lack of labelled reference data. Spatial resolution and availability of cloud-free observations considerably improved since the European Space Agency launched Sentinel-1 (2014) and Sentinel-2 (2015) imaging the whole globe with both radar and optical instruments. The optical sensor (Sentinel-2), for instance, provides a spatial resolution of up to 10 meters and temporal repetition of 5 days that can significantly improve the accuracy of crop type mapping [4]. Furthermore, crop classification accuracy improves by fusing radar and optical data that can also be critical to classify crop types in very cloudy regions [5]. However, including more data implies additional computational demand, which is still a limiting factor to use high-resolution earth observation data for large-scale mapping.
Another constraint to large-scale crop type mapping is the lack of labelled reference data for supervised classification. Attempts to scale-up crop classification using machine learning have already shown promising results when tested against various landscapes worldwide. However, to reach a reasonable accuracy, crop type classifiers require large sets of labelled training data to cover the whole variability within the study areas.
In FINEPRINT, we work towards improving assessments of global supply chains using satellite earth observations. We integrate automated crop type mapping derived from Landsat image time series (30 m resolution) to trade statistics to assess the environmental impacts of agricultural production, for example, deforestation and biodiversity loss. We conducted a pilot test in the Brazilian state of Mato Grosso, where we derived crop type maps using supervised Random Forests classification. This data was then integrated with trade statistics and will be linked to the FABIO model in the next step. This approach will produce a bottom-up account of the spatially explicitly impacts caused by primary agricultural production, for example, regarding land use change. Although this is not sufficient for a complete spatially explicit assessment of biomass supply chains, the additional information produced via satellite earth observation is critical to account accurately for the direct impacts of the agricultural sector.
Environmental impacts of mining
Mining locations and production data are available from different data sources, for example, from the SNL Metals and Mining database [7]. However, these data sets do not contain further information on land use and environmental impacts. Mining of metal ores and non-metallic minerals fragments and degrades natural habitats and is often characterised by high levels of water pollution and mining waste production which can extend far beyond the actual boundary of a mining area. These impacts require spatially explicit assessments, mainly related to the raw material extraction sites, where most of these environmental impacts occur. Many of these impacts can be detected using available high or very-high resolution satellite imagery.
Sentinel-2, for example, provide sufficient detail to map large-scale mining, such as the Carajas Iron Ore Mine in Para, Brazil (see Figure 1). In this example, we draw the mining area from Sentinel-2 using visual interpretation, from which we can derive, for example, the direct mining land use intensity and the amount of deforestation over a specific period.
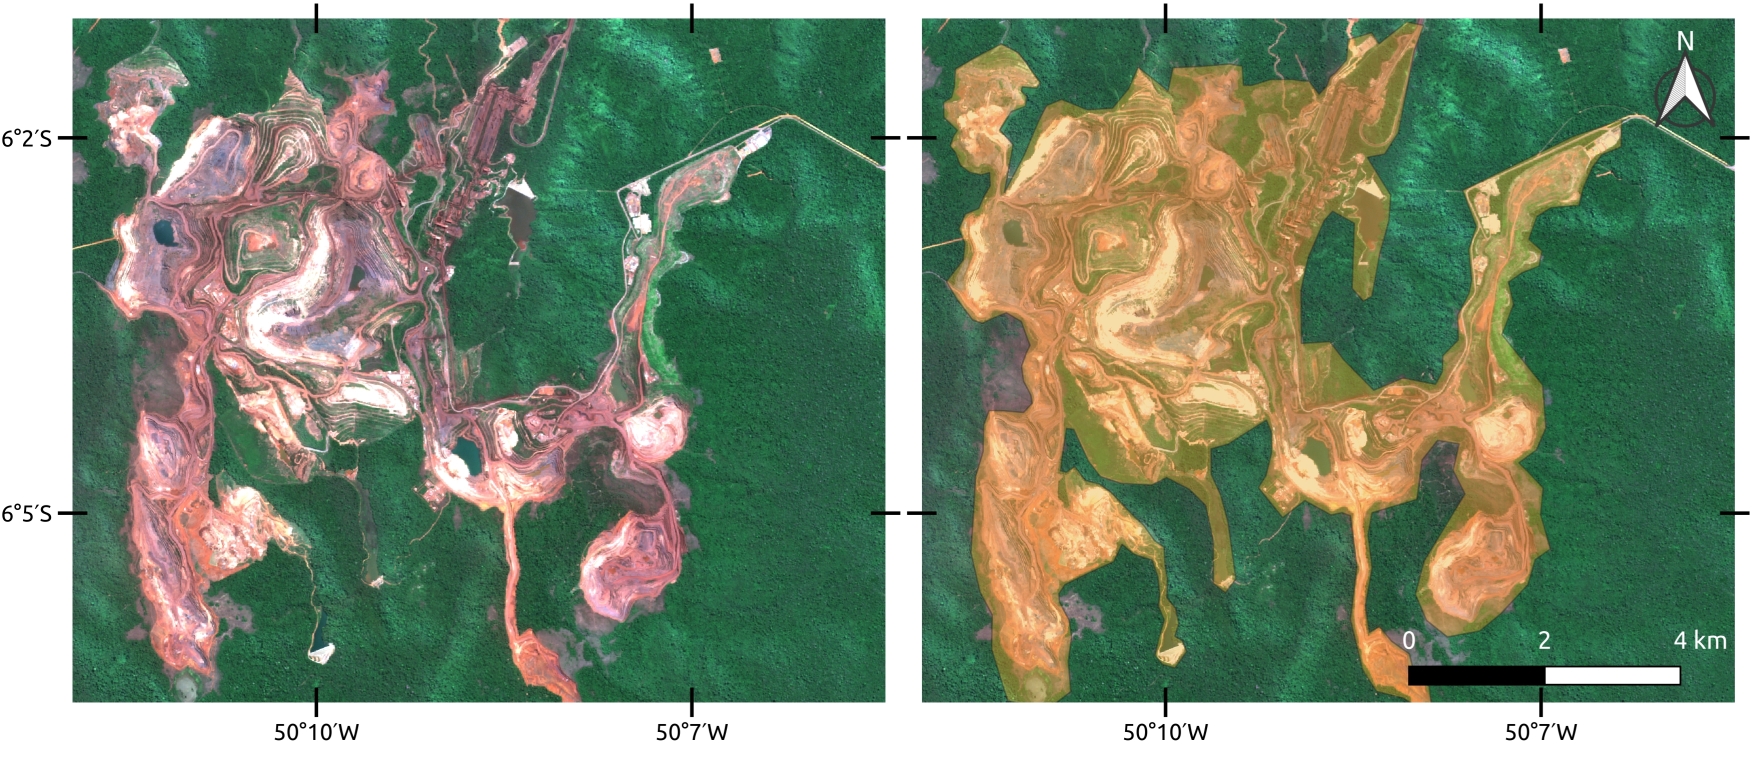
Figure 1: Carajas Iron Ore Mine in Para, Brazil. Sentinel-2 image (left), polygon of mining land use from visual interpretation (right)
Although openly available Sentinel-2 data provides useful information to calculate the land use intensity of mining, it does not provide sufficient details to distinguish targets within the mining area that could indicate other environmental liabilities to the surrounding areas, such as acid mine drainage from rock piles. Such ground features within mining areas can be labelled using very-high resolution images, for example, based on Google Earth and Microsoft Bing imagery. Using Google Earth, it is possible to identify features within the mining lease [8], such as open pits, tailing dams, waste rock dumps, water ponds, and processing infrastructure (see Figure 2). This additional information about the mining activities helps to assess the liabilities whose effects can go beyond the mine itself, for example, water pollution or environmental disasters such those caused by bursting tailing dams.
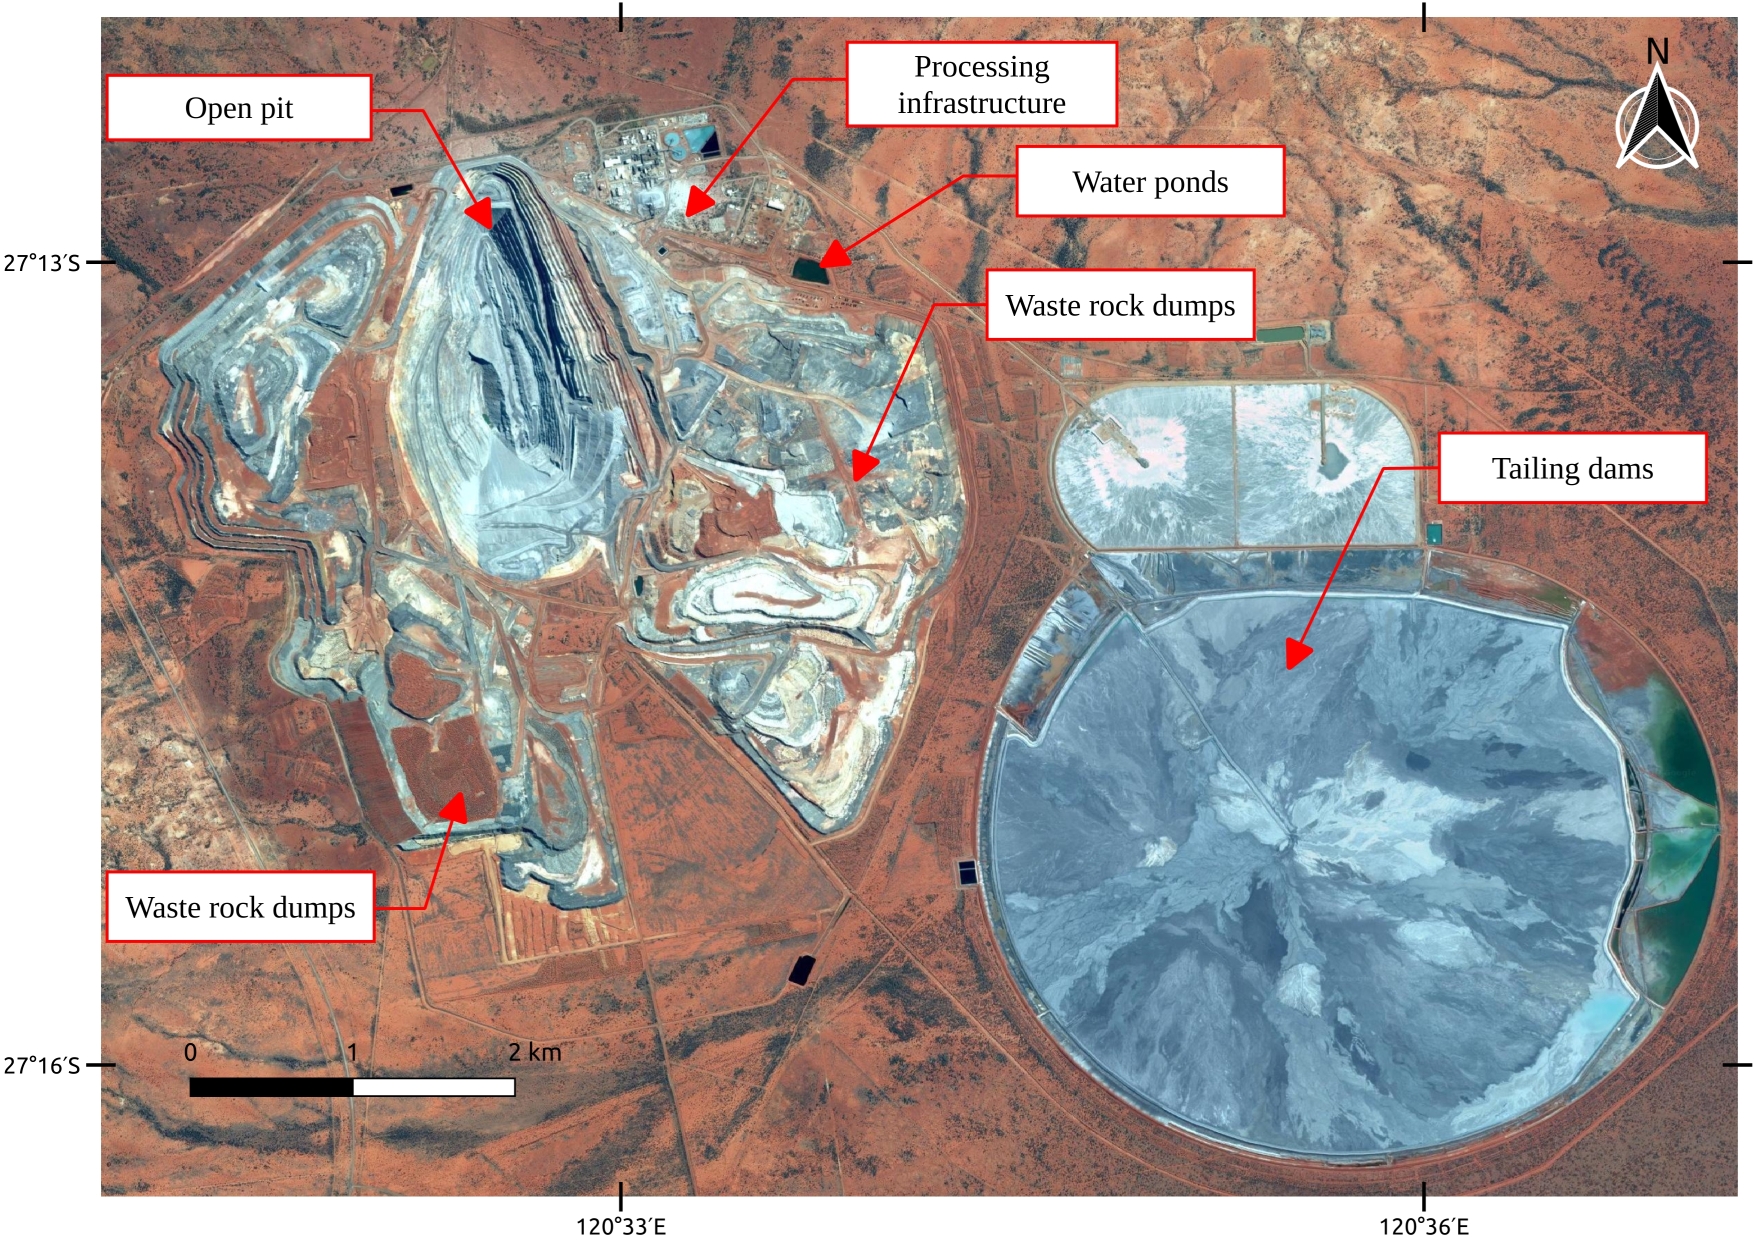
Figure 2: Labels with mining-related features in Mount Keith mine, Wiluna, Western Australia, visualised from Google Earth imagery
Satellite data has long been used to assess local impacts of single mines or mining areas [8]; however, a comprehensive assessment of the global mining sector is not yet available. In FINEPRINT, we created a data set on the direct land use of more than 6,000 mines worldwide based on visual interpretation of satellite images from different sensors. The data set contains more than 20,000 polygons indicating the size of the extraction site and the corresponding mining infrastructure (see the FINEPRINT Viewer). While this first data set does not distinguish different features within a mine, in the future, novel semantic segmentation algorithms can be applied to automatically label ground features within mines. Further, this new data set can be linked to other high-resolution data, such as on forest cover, in order to assess the deforestation impacts of mining in different world regions.
Solving these open remote sensing challenges will allow performing sustainability impact assessments of specific metals and minerals supply chains in the future. For example, companies that use metal ores in their electronic products, machinery or vehicles could refer to this information to select sourcing regions that have comparatively lower environmental impacts such as forest loss, water pollution or environmental liabilities.
Conclusions
Satellite data products of high spatial, temporal, and spectral resolution for the first time can provide the spatial data required to produce high-resolution maps of resource extraction and related environmental impacts on a global scale. However, many challenges remain open in order to provide suitable information to improve environmental assessments of supply chains. For instance, improving the availability of ground truth information used to train land cover classification models or developing new methods to link spatially explicit earth observation data to trade statistics. This is a precondition to accurately assess the local and regional impacts of commodity supply chains and international trade. The global maps of specific commodities, such as soybeans and iron ores, linked to supply chain models could provide the means to study drivers of local environmental impacts across international markets. Policy, business and consumers alike need this information to realise more sustainable production and consumption practices.
Citation
Maus, V. and Giljum, S., 2020. Using satellite earth observations to map global resource extraction and related environmental impacts. Examples from agriculture and mining. FINEPRINT Brief No. 10. Vienna University of Economics and Business (WU). Austria.
References
[1] Godar J, Persson UM, Tizado EJ, Meyfroidt P. Towards more accurate and policy relevant footprint analyses: Tracing fine-scale socio-environmental impacts of production to consumption. Ecological Economics 2015;112:25–35. doi:j.ecolecon.2015.02.003.
[2] You L, Wood S, Wood-Sichra U, Wu W. Generating global crop distribution maps: From census to grid. Agricultural Systems 2014;127:53–60. doi:10.1016/j.agsy.2014.01.002.
[3] Anderson W, You L, Wood S, Wood-Sichra U, Wu W. An analysis of methodological and spatial differences in global cropping systems models and maps. Global Ecology and Biogeography 2015;24:180–91. doi:10.1111/geb.12243.
[4] Vuolo F, Neuwirth M, Immitzer M, Atzberger C, Ng W-T. How much does multi-temporal Sentinel-2 data improve crop type classification? International Journal of Applied Earth Observation and Geoinformation 2018;72:122–30. doi:10.1016/j.jag.2018.06.007.
[5] Van Tricht K, Gobin A, Gilliams S, Piccard I. Synergistic use of radar Sentinel-1 and optical Sentinel-2 imagery for crop mapping: A case study for belgium. Remote Sensing 2018;10. doi:10.3390/rs10101642.
[6] Salehi B, Daneshfar B, Davidson AM. Accurate crop-type classification using multi-temporal optical and multi-polarization SAR data in an object-based image analysis framework. International Journal of Remote Sensing 2017;38:4130–55. doi:10.1080/01431161.2017.1317933.
[7] S&P Global Market Intelligence. SNL Metals and Mining Database 2019.
[8] Werner TT, Bebbington A, Gregory G. Assessing impacts of mining: Recent contributions from GIS and remote sensing. The Extractive Industries and Society 2019;6:993–1012. doi:10.1016/j.exis.2019.06.011.