


The global economy uses more than 100,000 km² of land for mining
Victor Maus, Stefan Giljum, Jakob Gutschlhofer, Sebastian Luckeneder & Mirko Lieber
FINEPRINT Brief No. 16, November 2022
The growing demand for minerals is pushing mining activities into new areas increasingly affecting biodiversity-rich natural biomes. Mapping the land use of the global mining sector is a prerequisite for quantifying, understanding and mitigating negative environmental impacts caused by mineral extraction. As an update of our previous work mapping mining sites worldwide, we quantified the extents of almost 35,000 mining sites across the globe through visual interpretation of satellite images. We find that mining activities around the world occupy 101,583 km², around the size of South Korea. This to date most comprehensive dataset on global mining land use provides the foundation for multiple applications, for example, on the impacts of mining on deforestation and biodiversity loss.
This FINEPRINT Brief builds on the paper ‘An update on global mining land use’ published by Maus and colleagues in Nature Scientific Data. The dataset is available for download from PANGAEA and visualised with the FINEPRINT Viewer.
Driven by the growing global demand for raw materials, mineral extraction has expanded particularly into biodiversity-rich ecosystems in the past two decades [1], and demand trends are projected to further increase [2]. Mining can cause a wide range of adverse impacts during mining operation and after closure, e.g. fragmenting the landscape and polluting soils and water with effects on human settlements, agriculture plantations, and natural ecosystems [3]. Mapping the global mining areas is increasingly important for quantifying pressures of mineral extraction on biodiversity, land-use modelling, estimating the impacts of global supply chains and sustainable resource use, for risk assessments of major environmental disasters on mining areas and planning and reinforcing mine reclamation.
The increasing availability of high-resolution Earth observation data and new machine learning approaches has allowed mapping and monitoring of mining land use and its related environmental impacts on a local or regional scale. However, this approach is limited for global analyses as land cover types and different extraction materials show a high heterogeneity, thus challenging automated mapping approaches using Earth observation data on a large scale.
Alternatively, visual interpretation of high-resolution satellite images can be applied to create global mining land use data sets. The current update of the first version of our dataset increases coverage substantially and now contains 44,929 polygons covering a total of 101,583 km2. It includes large-scale mining (LSM) as well as artisanal and small-scale mining (ASM). In the update version, we followed a similar methodology based on visual interpretation to map all 34,820 mining coordinates reported in the SNL Metals & Mining database [4]. The SNL Metals & Mining database provides information on mines worldwide and covers particularly coal and metal ore extraction. Although significantly expanded, our dataset still does not cover all existing mines worldwide, as we only inspected areas within a 10 km buffer around the coordinates from SNL. However, to date, our updated dataset provides the most comprehensive information on global mining land use, including openly available georeferenced mining locations.
Methodology
Version 2 of the global-scale mining area dataset builds on the polygons from the first data release [5] and follows a similar methodology. We updated the areas in the first version using satellite images from 2019 and added new areas not included in the previous version. We inspected all 34,820 coordinates reported in the SNL database, substantially expanding the coverage compared to Version 1, which covered only 6,201 coordinates of mines reported with the status “active” or having any reported production between 2000 and 2017. We inspected all SNL coordinates in the second version because several locations with “inactive” status and no reported production have clear ongoing mining activities visible in satellite images. Therefore, inspecting all SNL coordinates independently from their reported status was critical to provide a more comprehensive overview of the global mining land use. This data update also improved the coverage of ASM areas, which were almost absent from the first version because most ASM activities do not report production or activity in the SNL database, although their approximate coordinates are reported.
Examples of mapped areas
Figure 1 shows examples of artisanal and small-scale mining (ASM) and large-scale mining (LSM) activities. The map in the top right of Figure 1 illustrates the spatial pattern of ASM gold mining in the Brazilian Amazon. In this region, mining activities can spread over hundreds of kilometres, usually following water streams. The same spatial pattern can be found in other areas worldwide, such as in Ghana. In the bottom right of Figure 1 we illustrate a LSM area with the example of the Toquepala copper mine in Peru. Other regions can be explored using the FINEPRINT Viewer .
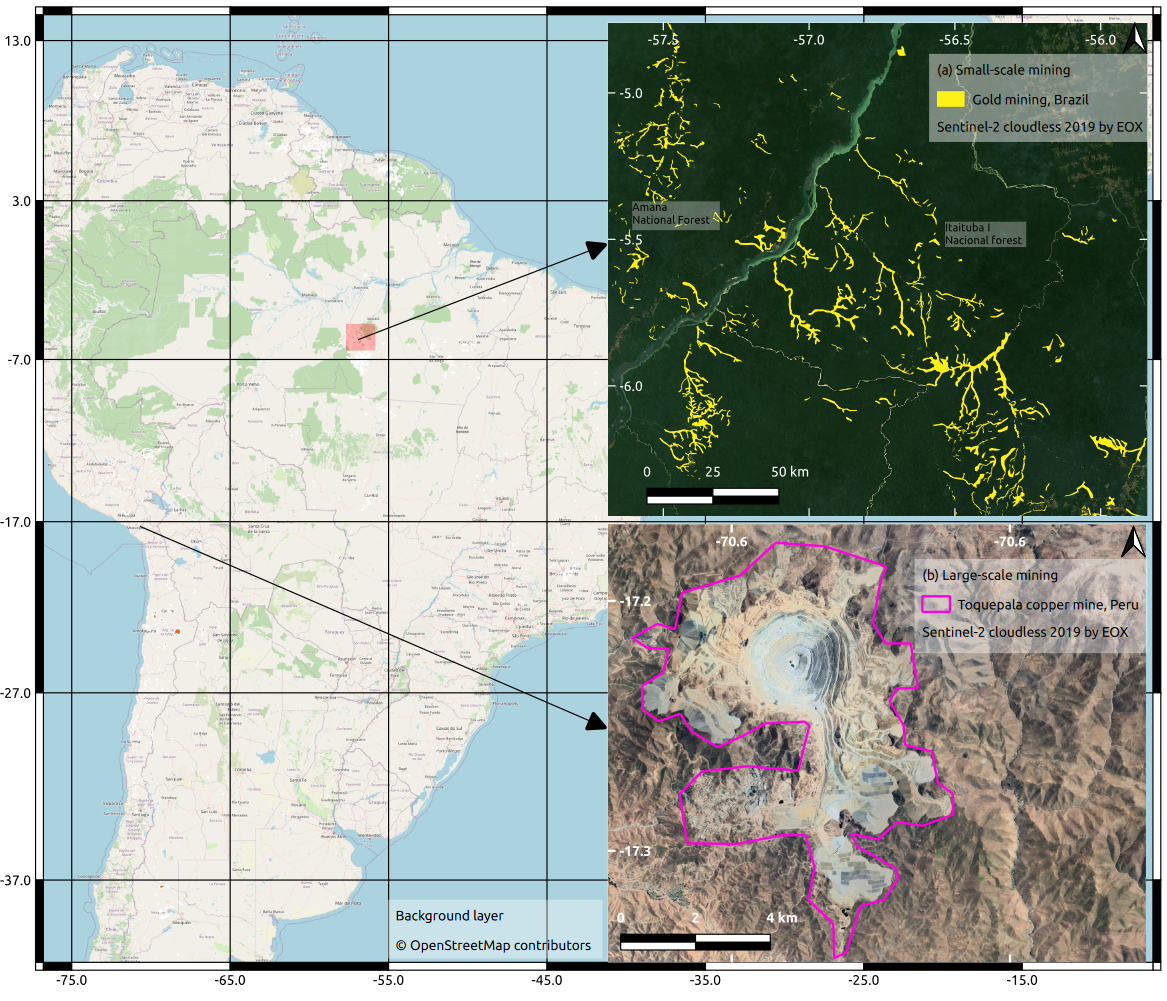
Figure 1: Mapped small- and large-scale mining in South America. (a) Small-scale gold mining in the Brazilian Amazon on both sides of the Tapajós River in the Brazilian state of Pará. (b) Toquepala copper mine in Tacna Province, Peru.
Figure 2 shows the geographical distribution of the mining area across the globe. Except for Antarctica, mining spreads across all continents with some hot-spot regions, for example, in northern Chile mainly due to copper extraction, north-eastern Australia and East Kalimantan in Indonesia because of coal mining, and in the Amazon rain forest primarily due to small-scale gold mining.
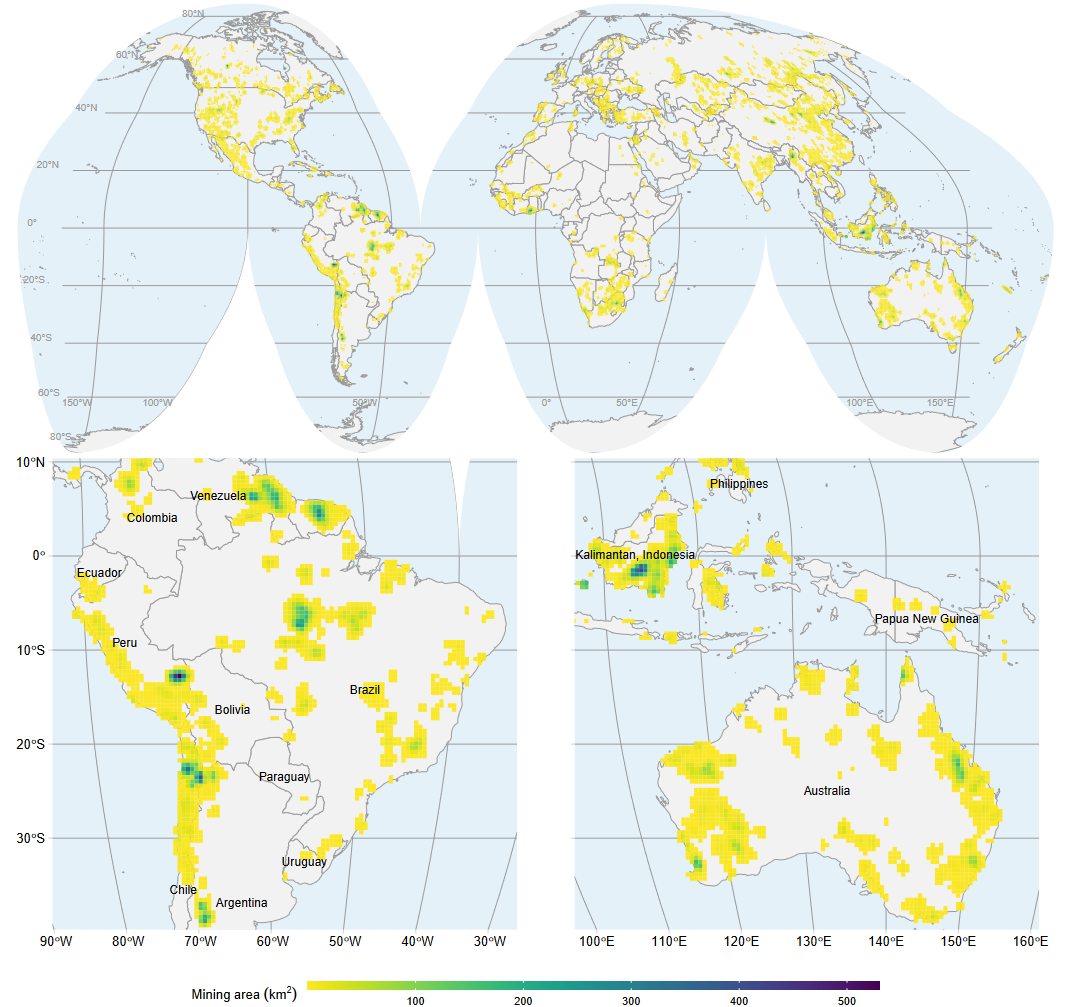
Figure 2: Global overview of mining areas mapped in Version 2 aggregated to 50x50 km grid cells. The maps at the bottom are zoomed to South America (left), and Australia and parts of South-East Asia (right).
A summary of our data aggregated by country shows that 52% of the mapped mining area is concentrated in only six countries: Russia, China, Australia, the United States, Indonesia, and Brazil. Another 21 countries account for 39%, and the remaining 118 countries add up to only 9% of the total mapped mining area. These results show that mining areas are highly concentrated in only a few countries.
Application
Our new dataset on global mining areas can easily be overlaid with other geospatial variables for further spatial analysis and for setting up a monitoring system to evaluate the environmental impacts of worldwide mining activities. For example, spatial analyses could include information on deforestation, biodiversity loss or protected areas. Thus, the update of this dataset – especially through the increased coverage – can help improving environmental pressure and impact assessments of the global mining sector. Additionally, the data can serve as a benchmark for further monitoring the temporal evolution of mining sites around the world and as training and validation data to support automated classification of mines using satellite images.
Citation
Maus, V., Giljum, S., Gutschlhofer, J., Luckeneder, S., Lieber, M. 2022. The global economy uses more than 100,000 km2 of land for mining. FINEPRINT Brief No. 16. Vienna University of Economics and Business (WU). Austria.
References
[1] Luckeneder S, Giljum S, Schaffartzik A, Maus V, Tost M. Surge in global metal mining threatens vulnerable ecosystems. Global Environmental Change 2021;69:102303. doi:10.1016/j.gloenvcha.2021.102303.
[2] UNEP IRP. Global Resources Outlook 2019: Natural resources for the future we want. A report of the International Resource Panel, United Nations Environment Programme, Nairobi 2019.
[3] Bridge G. Contested terrain: Mining and the environment. Annual Review of Environment and Resources 2004;29:205–59. doi:10.1146/annurev.energy.28.011503.163434.
[4] SNL. Metals and Mining Database, S&P Global Market Intelligence, New York 2021.
[5] Maus V, Giljum S, Gutschlhofer J, da Silva DM, Probst M, Gass SL, et al. A global-scale data set of mining areas. Nature Scientific Data 2020:289. doi:10.1038/s41597-020-00624-w.