Global-scale data sets of mining areas
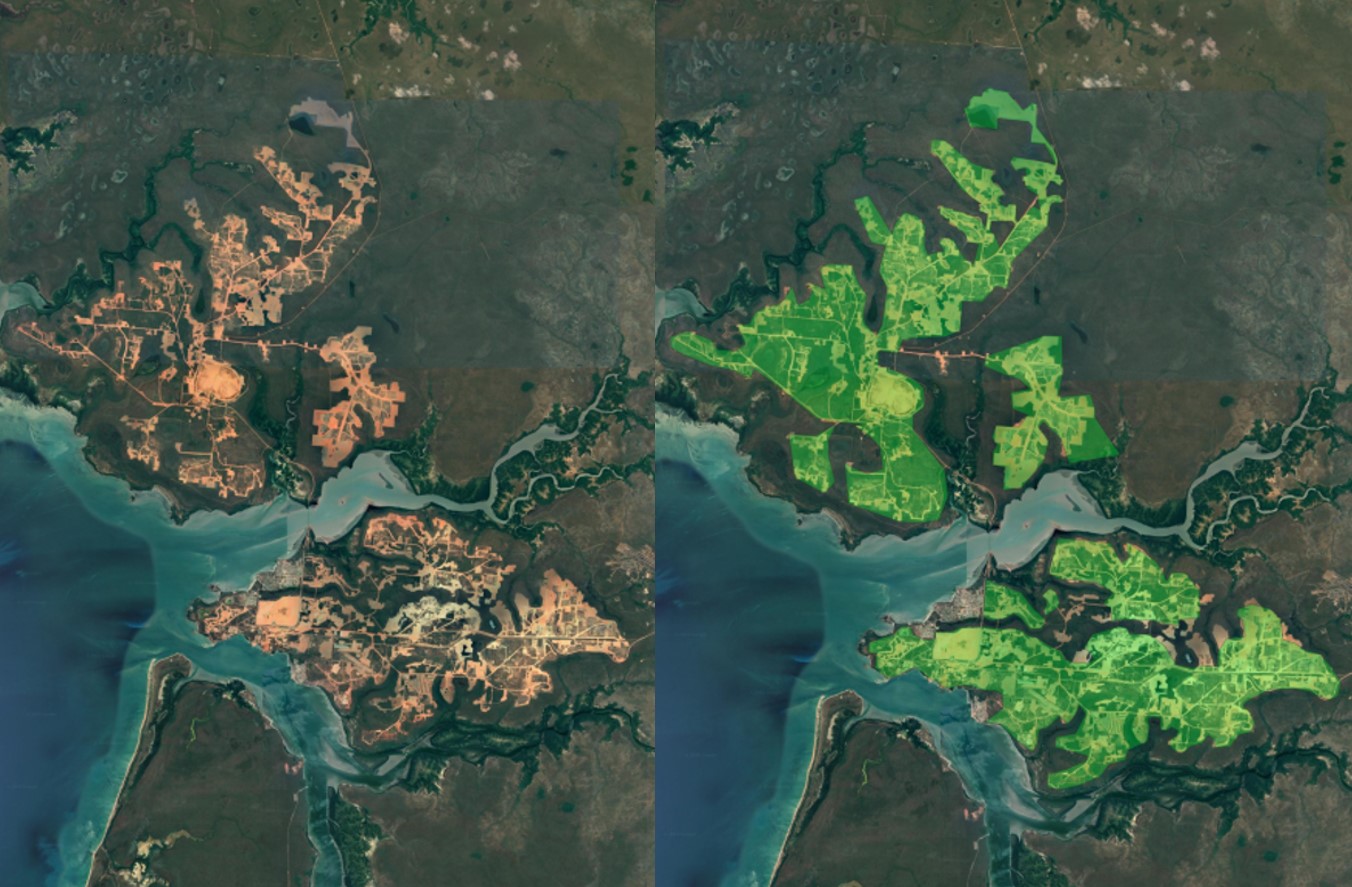
Based on the visual interpretation of satellite images, we are mapping mining activities over the entire globe and estimate the area directly used for mining activities, in particular of coal and metal ores. The mining polygons include all mining ground features identified from satellite, including open pits, tailing dams, waste rock dumps, water ponds, and processing infrastructure. So far, we published two versions of our data set.
Version 1 of the data set consists of 21,060 polygons that together represent 57,277 km² of surface area devoted to mining activities. It focused on mines that were active and reported production values in the time frame between 2000 and 2017. For the visual interpretation, we used several available satellite data sources, including Google Satellite and Microsoft Bing Imagery as well as Sentinel-2 cloudless by EOX IT Services GmbH.
For Version 2 of the data set, we analysed more than 34,000 mining locations across the globe using Sentinel-2 images for 2019. Version 2 contains 44,929 polygon features that cover 101,583 km² land area and include both large-scale mining as well as artisanal and small-scale mining.

Download of data and code
Version 2:
The full data set of Version 2 is available for download from the PANGAEA platform.
Code and geoprocessing scripts are available from our GitHub platform or from Zenodo.
A data descriptor publication (Maus et al., 2022) can be accessed at Nature Scientific Data.
Version 1:
Version 1 is also available for download from the PANGAEA platform.
The code for the web application to create the polygons can be accessed from our GitHub platform or from Zenodo.
A data descriptor publication (Maus et al., 2020) is available from Nature Scientific Data.

Data visualisation
FINEPRINT Viewer
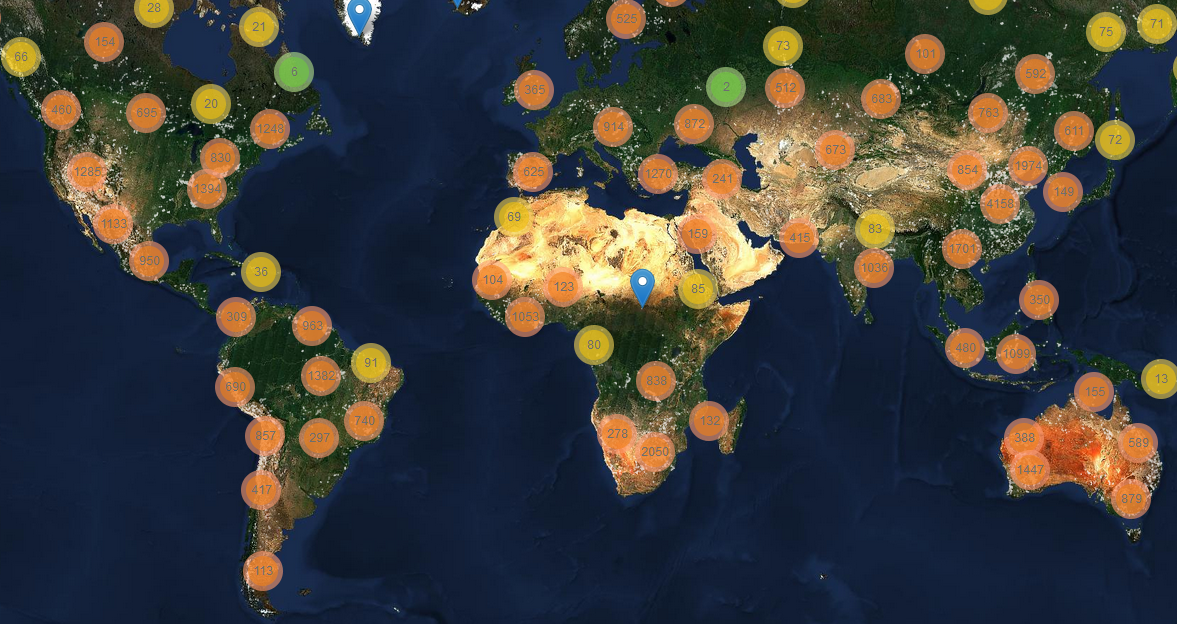
Both versions of the data set are visualised on an interactive world map that can be accessed at www.fineprint.global/viewer.
You can also access the data using a GIS interface through our WMS service.


